Data sourced from SnapStats Publishing.
August Market Update in North Vancouver
This is the price analysis for August 2021 in North Vancouver. See seller and buyer’s sales ratio, most active price band, most active neighbourhoods and property values.
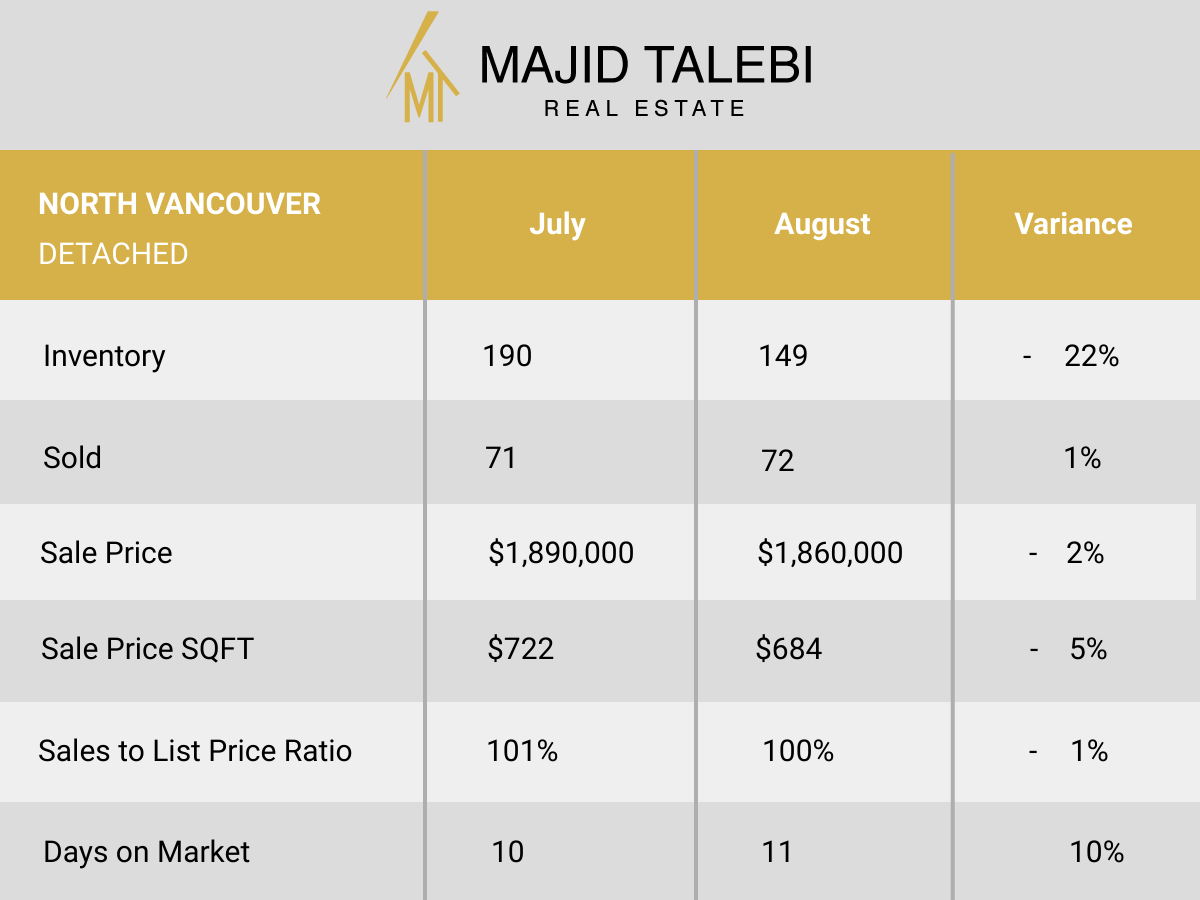
NORTH VANCOUVER
DETACHED
- MarketType Indicator NORTH VANCOUVER DETACHED:Sellers Marketat 48% Sales Ratio average (4.8 in 10 homes selling rate)
- Homes are selling on average 100% of list price
- Most Active Price Band**$1.5 mil to $1.75 mil with average >100% Sales Ratio (Sellers market)
- Buyers BestBet** Homes between $3 mil to $3.5 mil,Canyon Heights and up to 2 bedroom properties
- Sellers BestBet**Selling homes in Lynn Valley and 3 to 4 bedroom properties
**With minimum in ventory of 10 in most instances
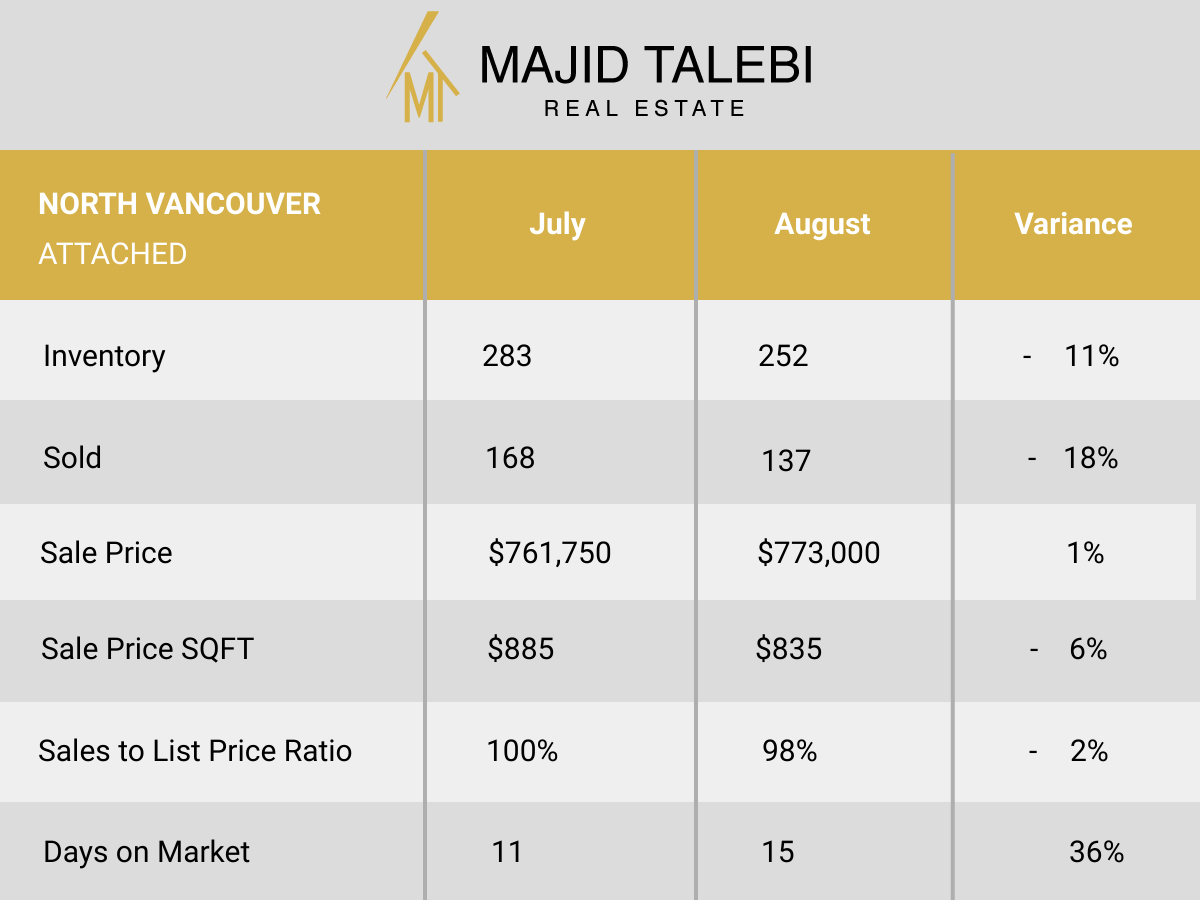
ATTACHED
- Market Type Indicator NORTH VANCOUVER ATTACHED:Sellers Market at 54% Sales Ratio average (5.4 in 10 homes selling rate)
- Homes are selling on average 2% below list price
- Most Active Price Band**$600,000 to $700,000 with average 96% Sales Ratio (Sellers market)
- Buyers BestBet**Homes between $900,000 to $1 mil,Edgemont,Lynnmour and 2 to 3 bedroom properties
- Sellers BestBet**Selling homes in Lynn Valley,Mosquito Creek and up to 1 bedroom properties
**With minimum in ventory of 10 in most instances